
gameserver-observability · v0.1.1
Demo stack
demo/docker-compose.yml runs the pack against the bundled simulated server
(demo/fake-fxserver/fake_fxserver.py): the scrape jobs, the exporter modules, the rules and the
dashboard, with Prometheus, json_exporter, blackbox_exporter and Grafana in containers on your
machine. Everything it shows is synthetic data from the bundled simulated server: there is no
game server and there are no players. Use it to look at the dashboard and the alerts before you
install anything, or to try a change of the pack.
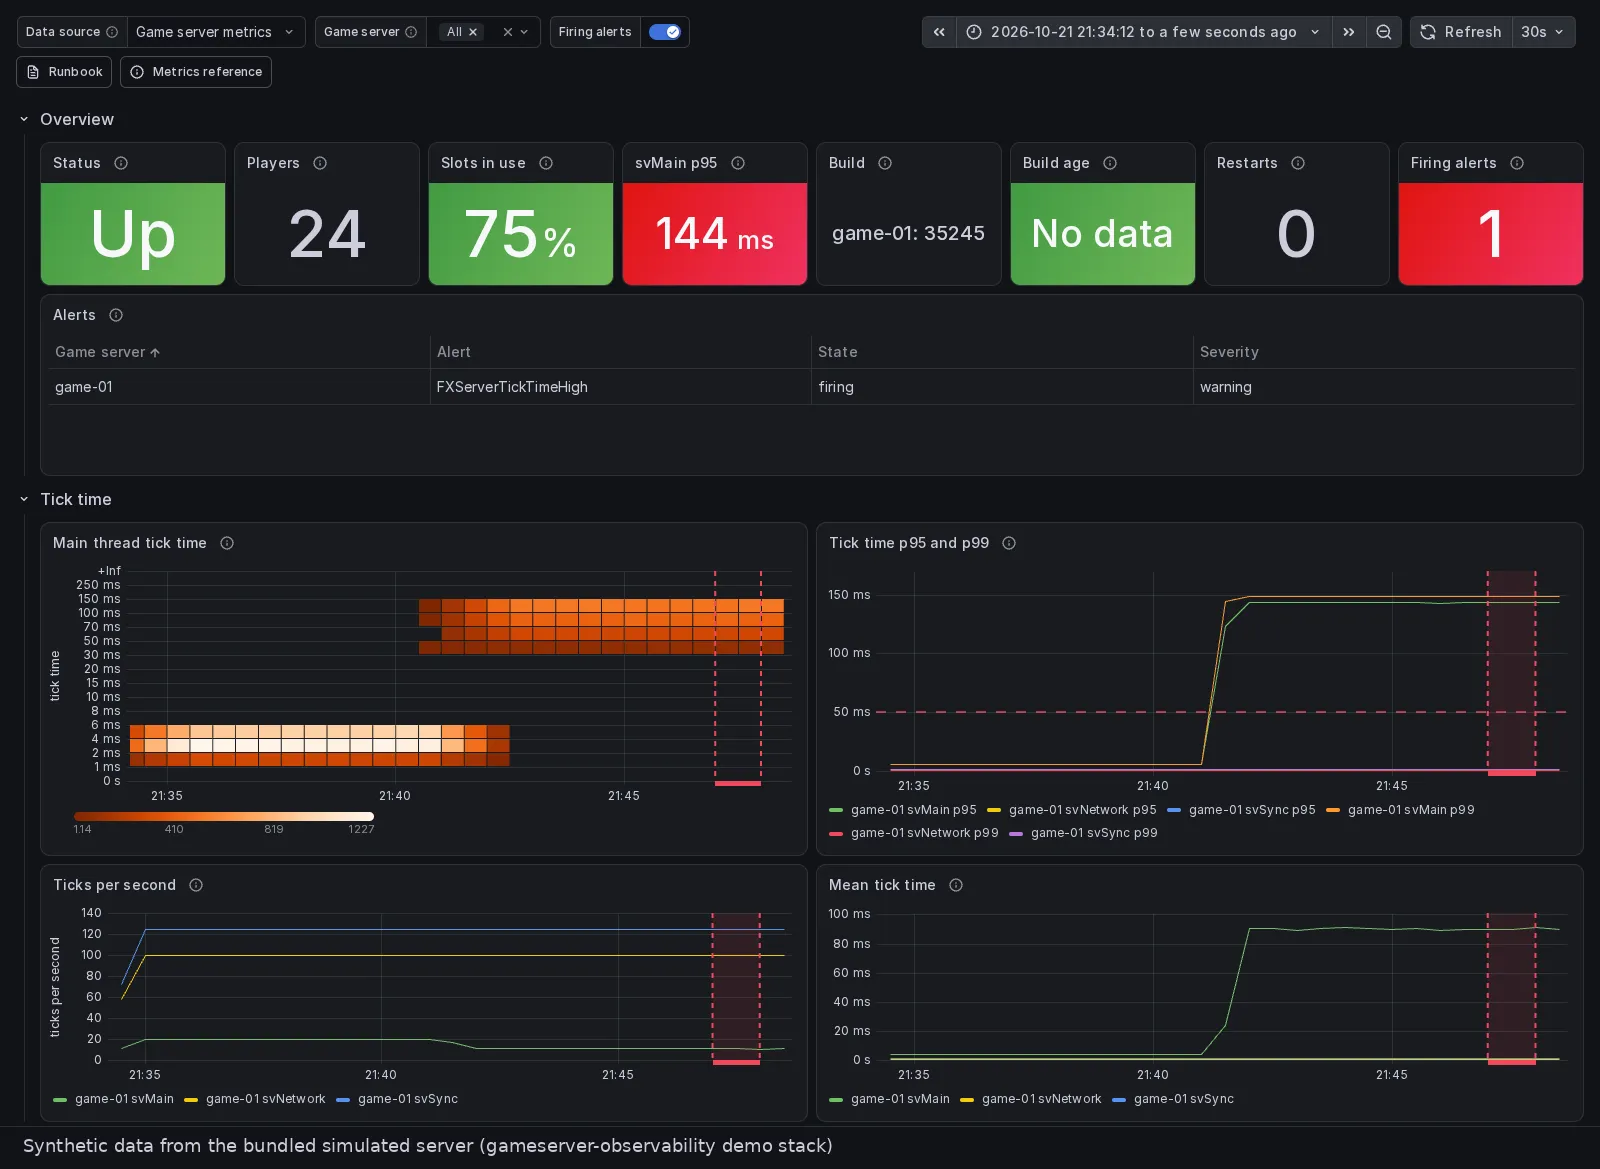
Synthetic data from the bundled simulated server: the dashboard of the demo stack while the
simulated server’s main thread ticks slowly and FXServerTickTimeHigh fires (how it was made:
Pictures).
Requirements
Docker Engine with the Compose plugin, and about 2.6 GB of disk for the five images (as Docker
29.2.1 reports their sizes; Grafana’s is 1.9 GB of it). Tested on 2026-10-21 and 2026-10-22 with
Docker Engine 29.2.1 and Docker Compose 5.0.2; CI starts the stack on GitHub’s ubuntu-24.04
runner (smoke test).
Start and stop
git clone https://github.com/luminare-dev/gameserver-observability.git && cd gameserver-observability
docker compose -f demo/docker-compose.yml up -d
Then open http://127.0.0.1:3000/: Grafana shows “Game server overview” as its home page, without
a sign-in. Prometheus is at http://127.0.0.1:9090/ (Status → Targets, Alerts). The rules need
about a minute for the first recorded values, so the tick-time panels fill after that.
docker compose -f demo/docker-compose.yml down -v # removes the containers, the network and the data
If a port is taken, choose others for the host side; the stack itself does not change:
GSO_DEMO_GRAFANA_PORT=13000 GSO_DEMO_PROMETHEUS_PORT=19090 GSO_DEMO_GAME_PORT=40130 \
  docker compose -f demo/docker-compose.yml up -d
What runs
| Service | Image (pinned by digest, toolchain) | What it does | Listens on |
|---|---|---|---|
prometheus |
prom/prometheus:v3.15.0 |
The pack’s scrape jobs (prometheus/scrape/fxserver.yml) and rules (rules/*.yml); prometheus/prometheus.demo.yml is the main config of the installation guide |
9090, published on 127.0.0.1 |
fxserver |
python:3.13-slim |
The simulated server: 3 of 32 players, /perf/ behind basic auth, a load knob |
30120, published on 127.0.0.1 |
json-exporter |
quay.io/prometheuscommunity/json-exporter:v0.8.0 |
The modules of json_exporter/config.yml |
127.0.0.1:7979, inside the stack only |
blackbox-exporter |
prom/blackbox-exporter:v0.29.0 |
The modules of blackbox/blackbox.yml |
127.0.0.1:9115, inside the stack only |
grafana |
grafana/grafana:13.2.4 |
The provisioning files and the dashboard of grafana/ |
3000, published on 127.0.0.1 |
The services share one network namespace, so the pack’s files are mounted from the repository as
they are, at the paths of the installation guide: inside the stack, 127.0.0.1 means the same as
on a single host (ADR 0020). The simulated
server and Prometheus share the demo’s /perf/ password synthetic-demo-only, which guards
synthetic data only; never use it for a real server.
Grafana has no account at all: every visitor is a viewer, nobody can sign in, and nothing can be changed in it. Its usage reports, update checks, news feed and plugin preinstalls are switched off, and the stack leaves out the optional version list job, which would fetch the platform’s version list from the internet.
Some panels stay empty, because the demo has nothing that feeds them: the rows Host and MariaDB
and the panels of the admin hostname and the tunnel need node_exporter, mysqld_exporter,
cloudflared and an admin hostname, and Build age needs the textfile metrics of the
luminare.gameserver collection’s fxserver role (metrics reference).
Simulate a load spike
The simulated server has a load knob on /fake/control (only on 127.0.0.1, see
demo/fake-fxserver/fake_fxserver.py for every field):
curl -X POST -d '{"clients": 20}' http://127.0.0.1:30120/fake/control                         # 20 players (0 to 32)
curl -X POST -d '{"main_tick_ms": 90, "for_seconds": 600}' http://127.0.0.1:30120/fake/control # slow ticks for 10 minutes
curl -X POST -d '{"restart": true}' http://127.0.0.1:30120/fake/control                       # tick counters from zero
With slow ticks, the svMain p95 and p99 rise above 100 ms within a minute, ticks per second
drop from about 20 to about 11, most ticks land in the heatmap’s buckets from 50 to 150 ms, and
FXServerTickTimeHigh becomes pending; it fires 5 minutes later and is gone about 80 seconds
after the spike ends. docker compose -f demo/docker-compose.yml stop fxserver stops the
simulated server: FXServerDown becomes pending within a minute and fires 2 minutes later;
docker compose -f demo/docker-compose.yml start fxserver brings it back with new counters (and 3
players again), and the Restarts panel counts the restart. These times were measured on this stack
on 2026-10-21 and 2026-10-22 (README, Results).
Smoke test
python3 scripts/smoke_demo.py
scripts/smoke_demo.py starts the stack under its own project name with free ports on
127.0.0.1, and checks through the APIs that every target of prometheus/scrape/fxserver.yml is up
and every probe succeeds (so /perf/ refuses requests without the password), that Prometheus has
the simulated server’s player count and players.json was never requested, that every rule file
is loaded and every rule evaluated without an error and no alert is active, and that Grafana
provisioned the dashboard read-only into the folder “Game server”, finds it by its title,
answers a query through the provisioned data source with the same player count, and refuses a
sign-in. Then it removes the stack with docker compose down --volumes, also when a check fails.
The CI job demo-smoke runs it on every pull request.
Pictures
Both pictures show this stack on 2026-10-21 and hold synthetic data from the bundled simulated
server only. After a few minutes with 3 players, the simulated server got 8, 13, 19, 22 and 24
players, a minute apart at first, and from the 19 on its svMain ticks took 90 ms on average for
9 minutes; then it went down to 17 and 12 players.
Synthetic data from the bundled simulated server: the run in 45 frames, each showing the 15
minutes up to its moment, 20 seconds apart (docs/media/dashboard-spike.gif, also at the top of
the README).
docs/media/dashboard.png (at the top of this page) was taken during the run,
while FXServerTickTimeHigh fired. The frames of docs/media/dashboard-spike.gif were drawn
after the run from the data Prometheus had recorded, each for a 15-minute window ending at its
moment, so that no panel shows values past that moment. Grafana ran in kiosk mode in headless
Chromium 156 (the chromedp/headless-shell image, pinned by digest in the
toolchain), driven by Playwright 1.64.0 over its
DevTools port on 127.0.0.1, 1600 pixels wide; the label below each picture was added with
Pillow, and the GIF was scaled to 1000 pixels. The pictures show the server label (game-01),
times and values, and no host name or address.
Not affiliated with or endorsed by Cfx.re, Rockstar Games or Take-Two.
Licensed under Apache-2.0. Source: luminare-dev/gameserver-observability at v0.1.1.